[The following text is written by the project group “Dutch Church Interior Paintings”. You will find more information on their project soon on their website, which will be linked here.]

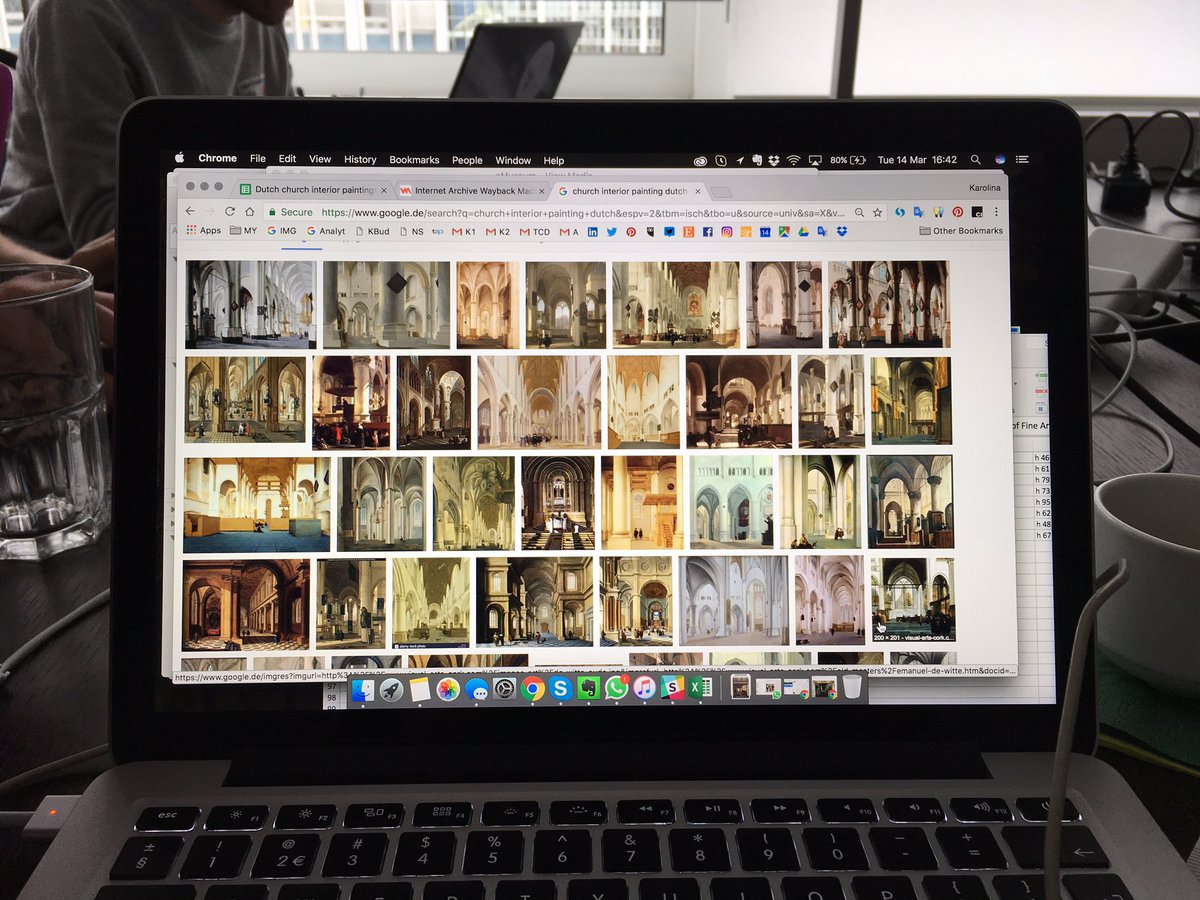
The genre of church interior paintings has developed in the Netherlands in the middle of the 17th century and lasted only a few decades. It is represented by a relatively small group of specialized artists, such as: Pieter Jansz Saenredam (1597-1665), Emanuel de Witte (1616-1692), Hendrick Cornelisz Van Vliet (1611-1675), Gerard Houckgeest (ca.1600–1661), Anthonie De Lorme (c.1610-1673) and others. In many cases, the same church’s interior was depicted by the same artists dozens of times, however, the iconography, composition and vantage point (a position from which the interior is viewed) varied. One of the main factors in the development of this type of painting was the Reformation and its consequences, particularly the Calvinist approach to art. The so-called Beeldenstorm in 1566, a series of events during which churches were plundered and their Catholic decorations removed or destroyed, was a starting point of this far-reaching transformation of church interiors in the Netherlands. The churches became obsolete civic spaces filled with everyday activities, not exclusively restricted to preaching the God’s word any more. The altars, statues and other decorative elements were replaced by white-washed walls and simple panels filled with biblical excerpts instead of representations of saints and miracles. This is reflected in the church interior paintings, where we can see, for example, a woman breastfeeding, children at play, groups of gentlemen involved in conversations about business, couples strolling down the aisles, beggars and even dogs urinating. The latter was perhaps the strongest symbol of this transition of the church as a building: from a holy temple to a civic, urban and mundane space.
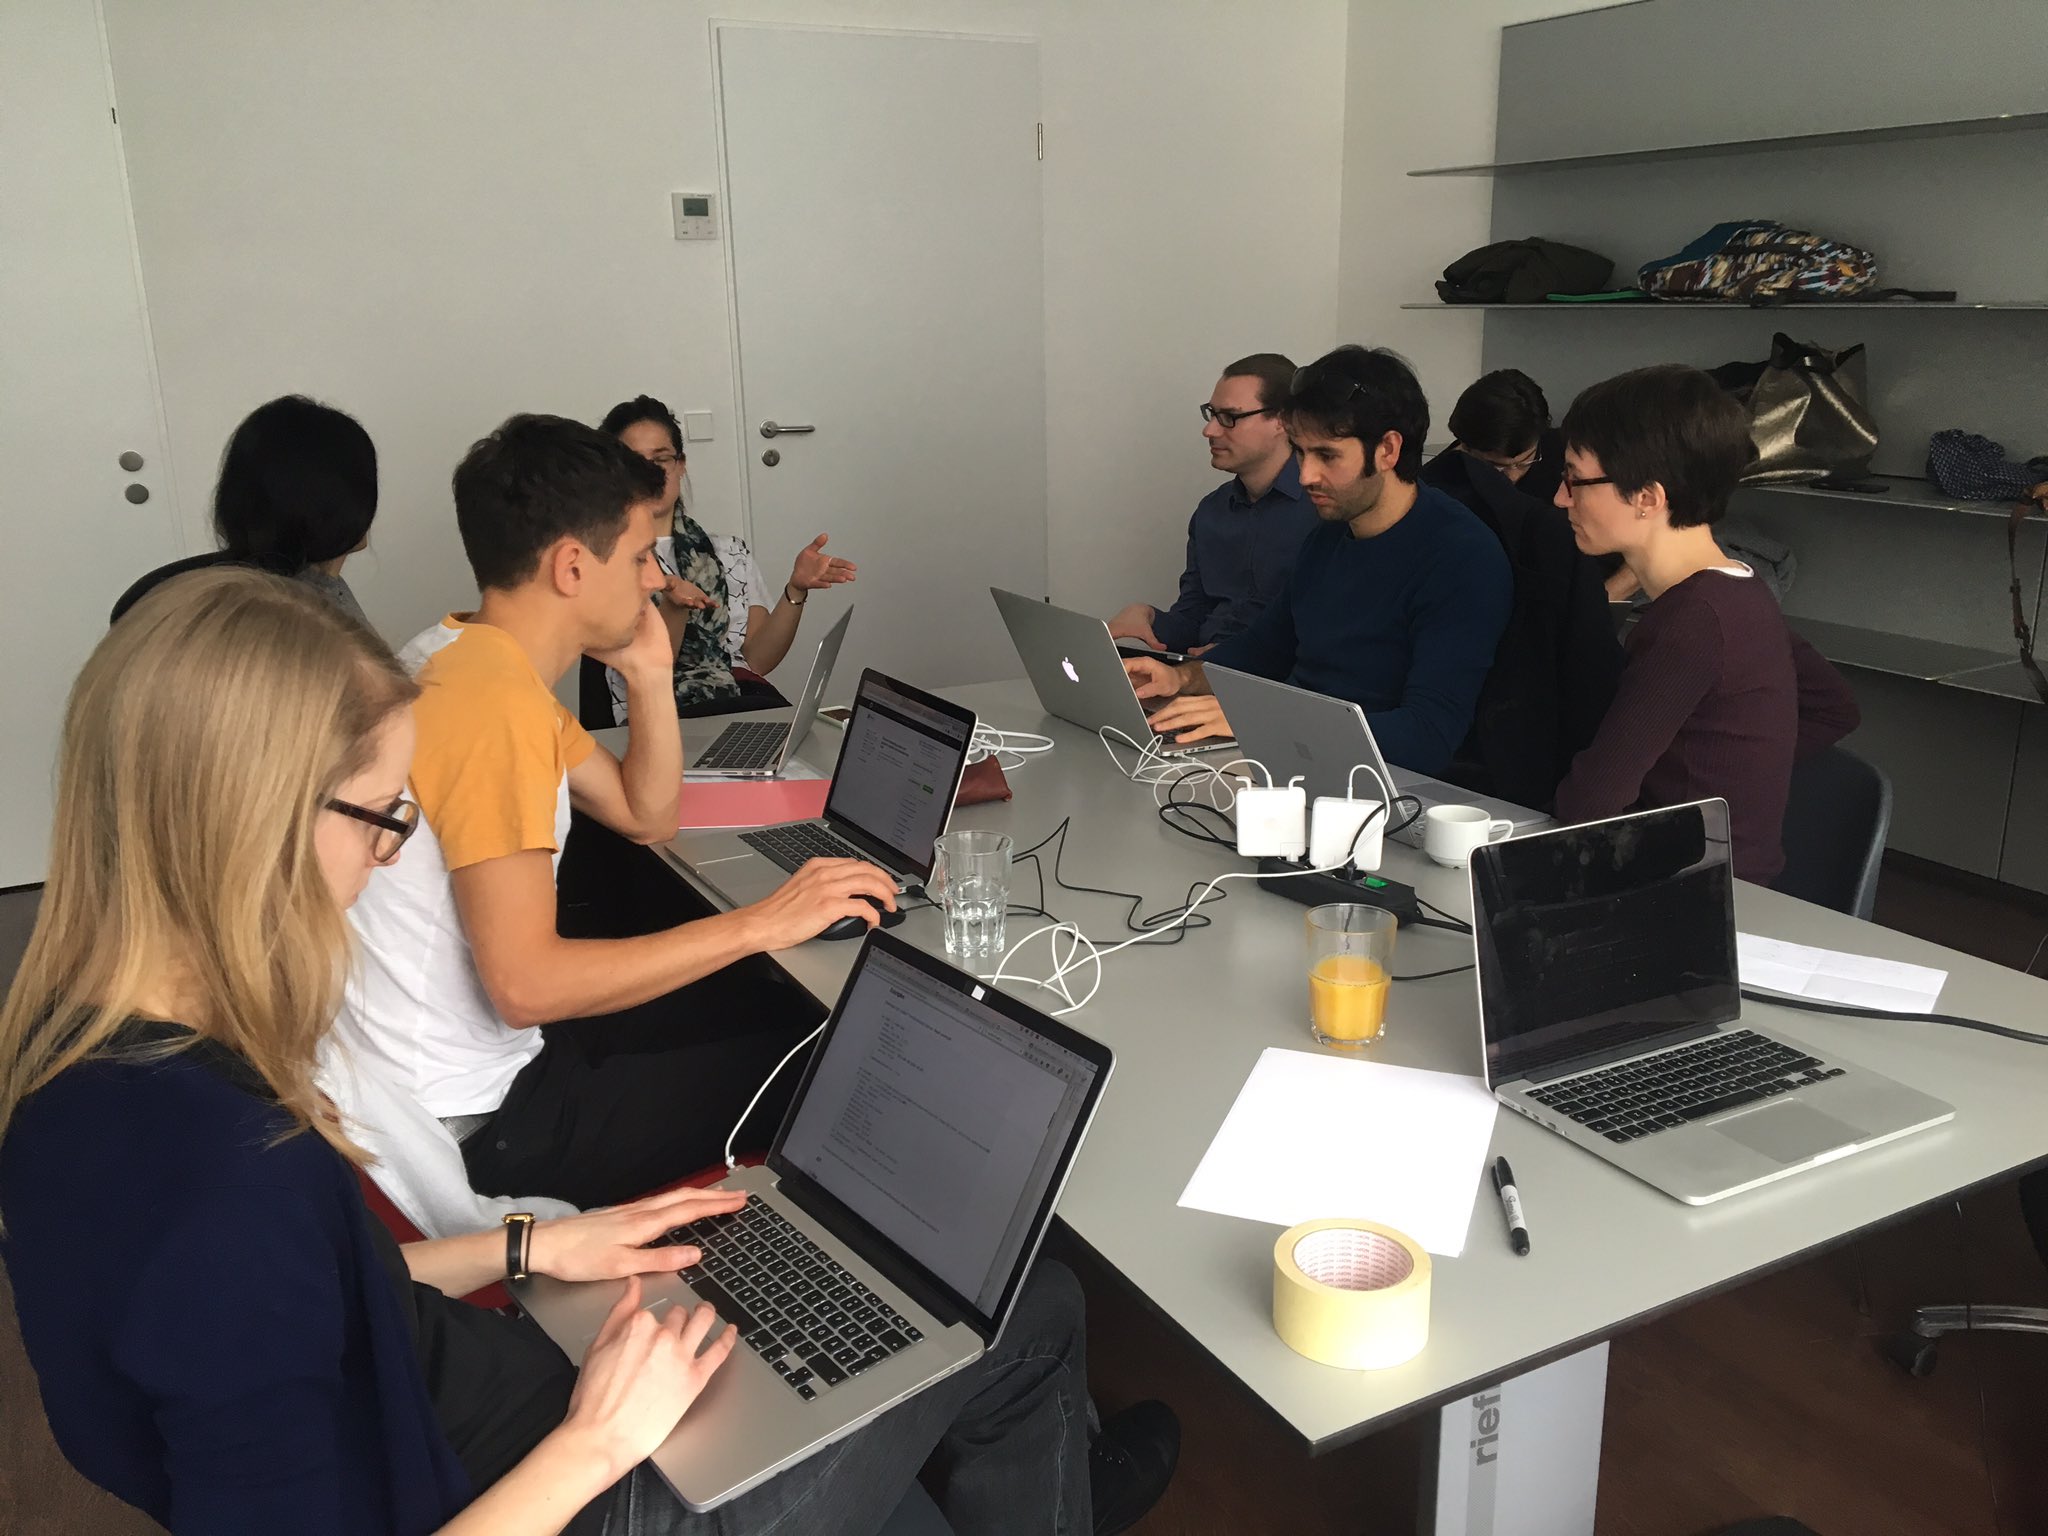
There are hundreds of church interior paintings scattered across collections around the world. The research of this subject to date has focused mainly on particular artists or churches, rather than the overall genre and its network of artists and places. This project, born at Coding Dürer 2017, addresses this issue by providing a platform for further research on the paintings and creating an insight into the bigger picture of the genre for the first time. This visualisation of over 200 paintings of 26 different churches by 16 different artists was created with the following research questions in mind:
- In what places the artists were active and in what places they depicted church interior(s)?
- Did the artists have ‘favourite’ church interiors?
- In what places and when could the artists possibly meet?
- What church interiors were depicted the most?
- What church interiors were depicted by most artists?
DATASET
The starting point of the project was a spreadsheet listing the paintings, artists, collections, etc. that was created for research purposes 2 years ago. This re-purposed data needed cleaning and additional information, e.g. IDs (artists, churches, paintings), locations (longitude, latitude), stable URLs for images.
GOAL
To create a map/visualisation that shows:
- Dutch churches depicted in the paintings (25)
- Artists’ activity (16+)
TOOLS
- Microsoft Cognitive Services – Computer Vision API: Calling to get more data for Images like colors, tags and alike
- Bash shell scripts, cURL: Itereating over data entries and fetching Computer Vision API responses and saving as well as transfoming data
- JSON, CSV, plain text files, Google Sheets: Saving API responses and
- Wikidata data entries: Filling gaps in data references
- Shiny by RStudio: A web application framework for the R programming language which turns data analysis into interactive web applications
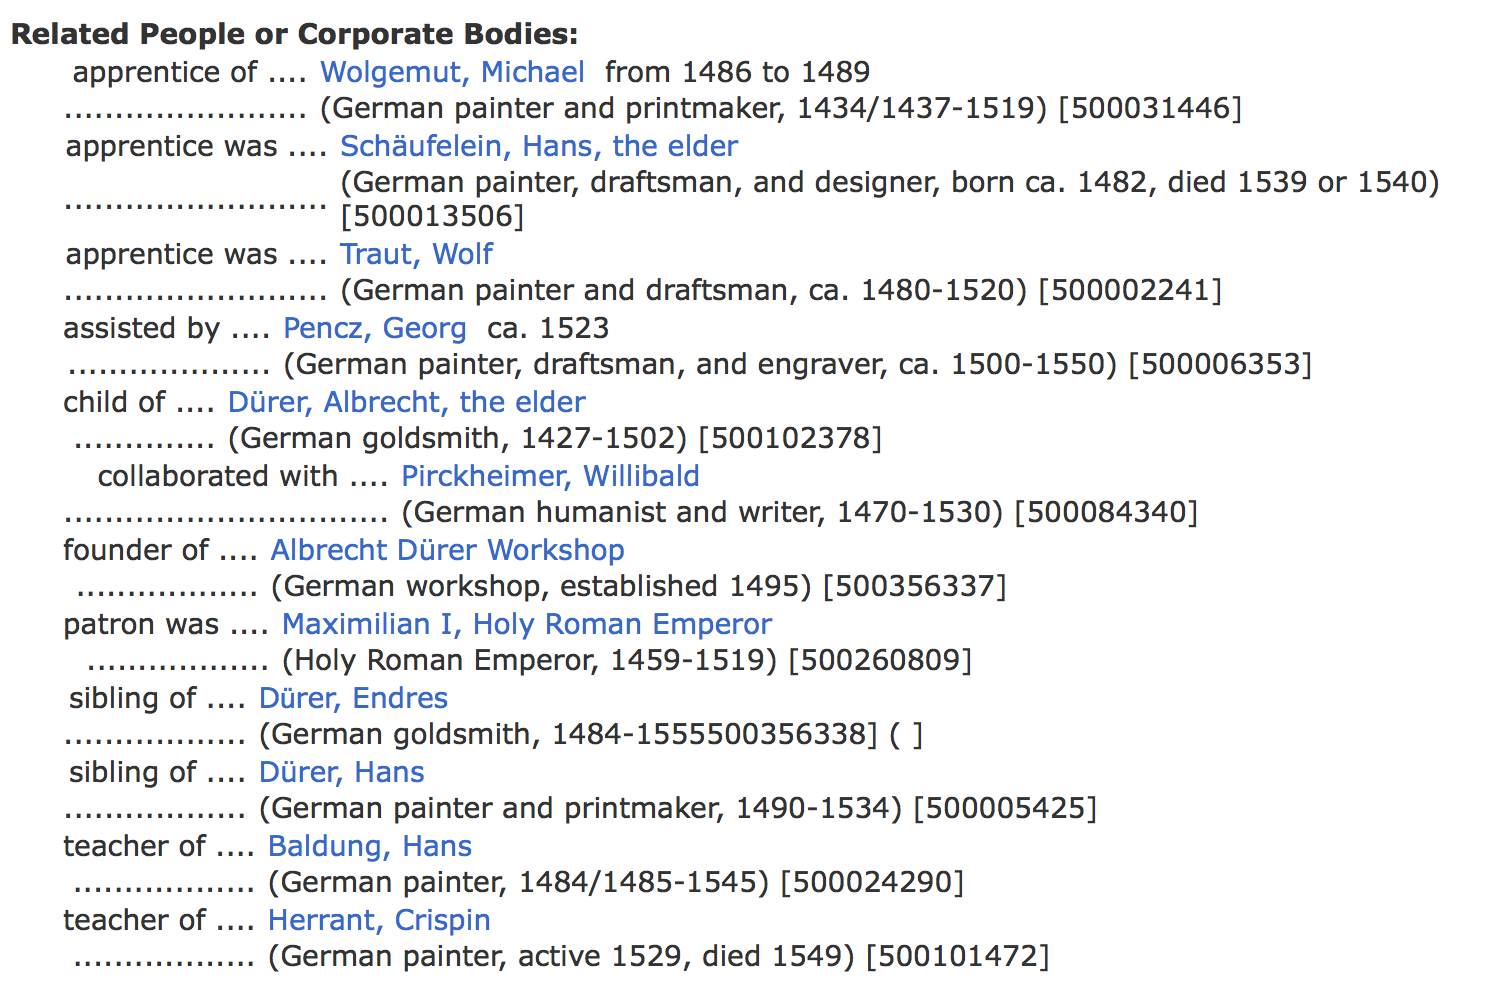
- The RKD (Netherlands Institute for Art History) Artists database was used for biographical information of the artists, particularly the details about their activity (location, years).
- Google Drive applications: used for collaboration and project management
- ULAN (Union List of Artist Names®), the Getty’s structured vocabulary, used for artists names


 Victoria Szabo, Justin Underhill and Benjamin Zweig want to visualize the interactions at the