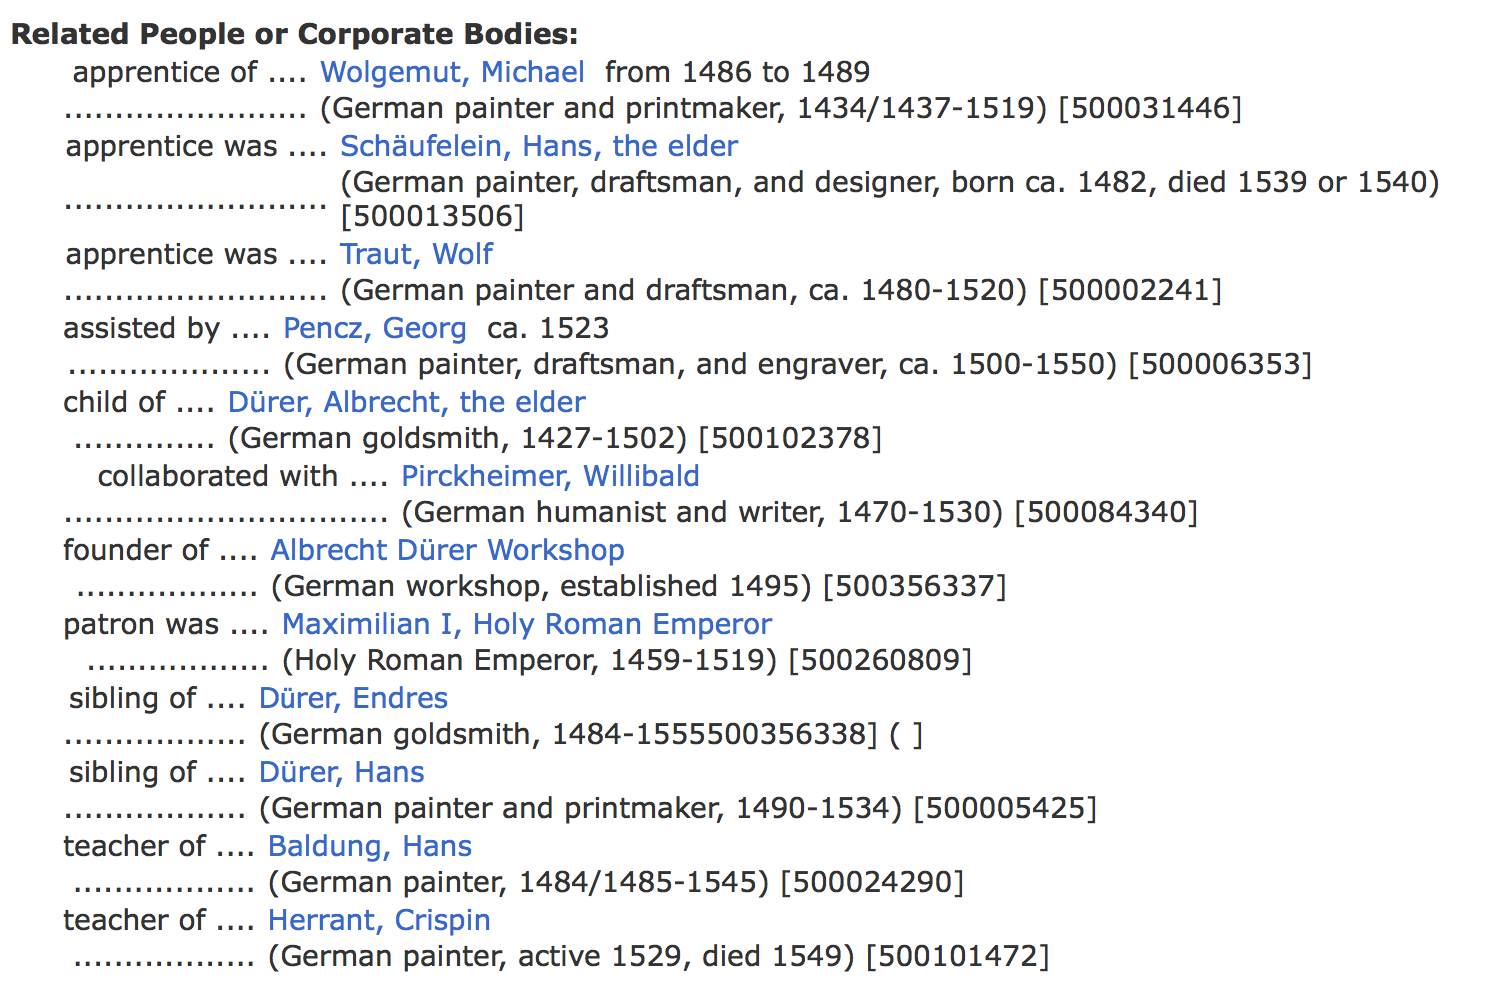

The topic of visualization is quite popular at Coding Dürer. We already saw an approach in visualizing interactions of photographers with an artwork as well as an attempt to show how the work of an artist moves around the world throughout time. The “meta data group” engages in a project that relates to the person who gave the Hackathon its name: Albrecht Dürer. The group wants to show to whom and how the artist was related. By creating a graphic plot they want to answer the question of the artist’s relationship to his contemporaries in a way that is intuitive and easy to understand. The main challenge the team faces is to find data that fits their research question. ULAN, the Union List of Artist Names from the Getty Research Institute, might offer a solution, as its data is organized in a network of categories like “assistant” or “teacher” which the team uses in recreating a network.